Shared data model for PowerBI and other reporting tools

Share on facebook
Share on twitter
Share on linkedin
Top 5 Business Intelligence(BI) tools to consider in 2022
Explore the best-performing BI tools currently in the market and compare their benefits with key highlights. Read More.
Top 5 Cloud Data Warehouses to Consider in 2022
Explore Snowflake, Amazon Redshift, Google BigQuery, Yellowbrick and Azure Synapse Analytics in detail. Snowflake Amazon Redshift Yellowbrick

Introduction

There are many tools on the market which provide us multiple ways of creating reports. It’s common that a company “A” prefers one reporting solution over the other, while company “B” has a completely opposite experience. The same goes for people – we also have our favorites – one wants to see a report prepared with PowerBI while the other would like to use Excel, simply because knows it better. Every time we need a report we need to prepare data first. Analytical and data visualization tools are different and require different skills to prepare data for reporting or analysis. It costs time, requires a tool-specific knowledge and of course provides redundant work in a layer between a data source and a reporting tool. How about having the shared data model prepared beforehand with a data virtualization tool like Lyftrondata and reused? Let’s have a look first at how it can look like when the whole setup is done with PowerBI. Then we will try to the same but with Lyftrondata as the virtual data layer. Goal We want to see a simple report with currency rates in relation to the Polish currency – Polish złoty (PLN). We would like to have a possibility to see which countries make use of which currency.

Sources

Here is a list of data sources we have used​
  • latest currency rates, based on PLN – http://api.fixer.io/latest?base=pln
  • currency codes to countries mapping – as an Excel worksheet.

PowerBI approach

First, we need to import sources to our report. On the source view to the right, we can find multiple steps that have been applied, before the whole query is ready to process. The source is in JSON with a child array of rates (record in PowerBI) – that is why there are transposing, merging or expanding steps on the list.

The second source also requires some rework. A few columns are not needed, also countries without a currency have to be removed.

Finally, we have got two queries ready. CurrencyNames is a source which is to be merged into the other one:

The next one, CurrenctyRatesPLNToday has been extended with the Country column. Now this one becomes the real source of our future report:

Having all in place we can get the final report rendered in PowerBI:

Our report is a map of countries and a table with currency rates. If a currency code is selected, the map shows all countries that make use of the selected currency. The steps above show how the finished, PowerBI-specific solution looks like. The result and the process itself is not sophisticated, but it has some drawbacks already:
  • It’s not possible to reuse data preparation steps in another reporting tool. If we want to use another tool, we have to implement all the steps again or move processing into Data Warehouse and expose data from there.
  • We are forced to import all data used from all the data sources into the tool because it is not possible to use data from more than one source in a direct-query mode in PowerBI. In other words, if you have a lot of data at your source, it may be challenging to process a high volume of data.

Let’s see if we can find another path to success, but this time we will make use of data virtualization capabilities of Lyftrondata.

A Lyftrondata-based approach utilizing data virtualization

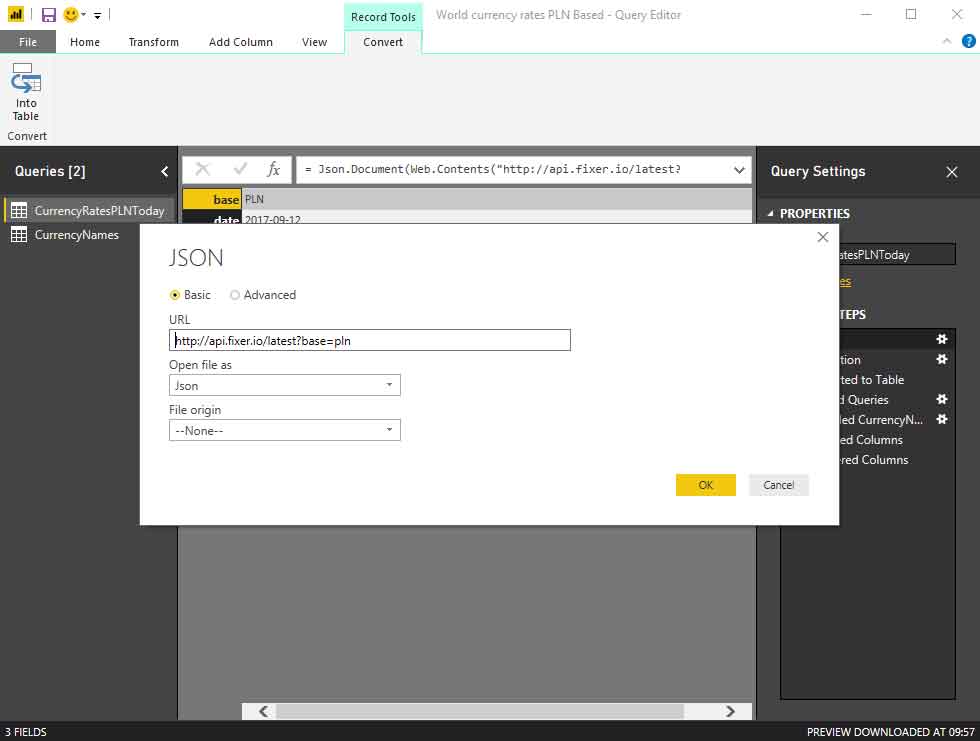
Similar to PowerBI, at the beginning, we need to establish connections to data sources. Let’s connect to Fixer.IO source: we need to select JSON data provider and enter URL and JSON path to the repeating element, which in our case is just “$” (the root):

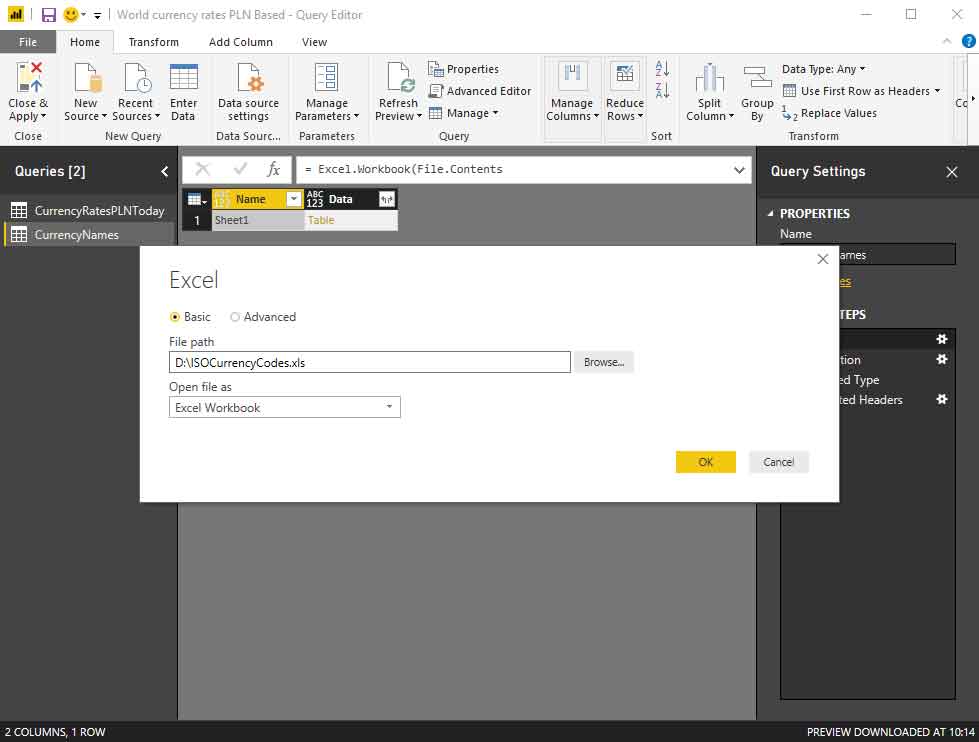
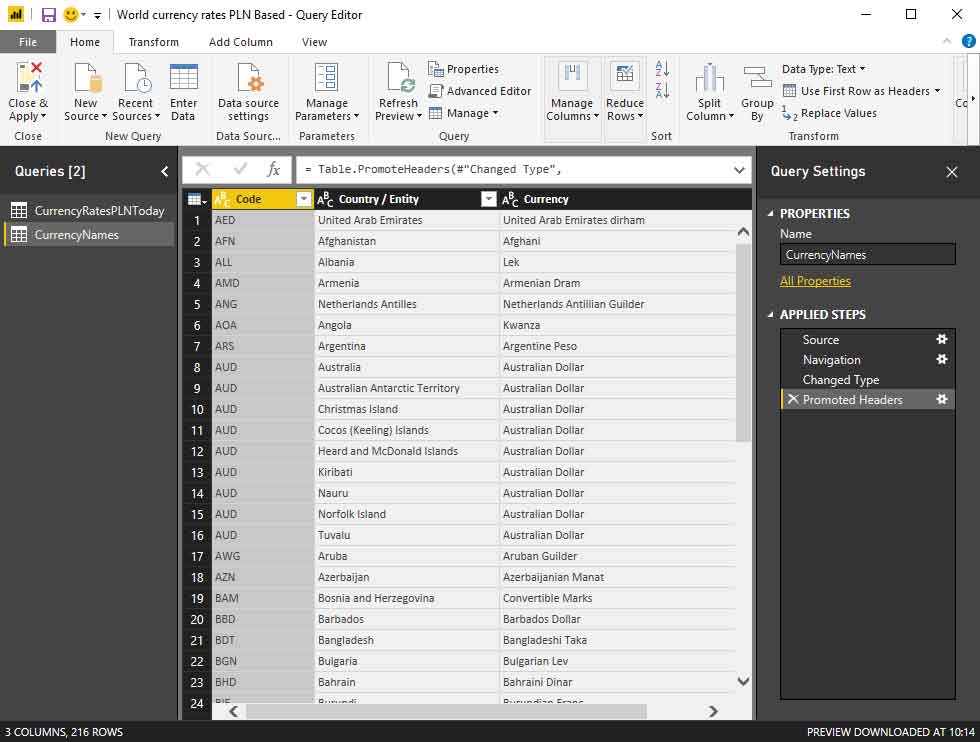
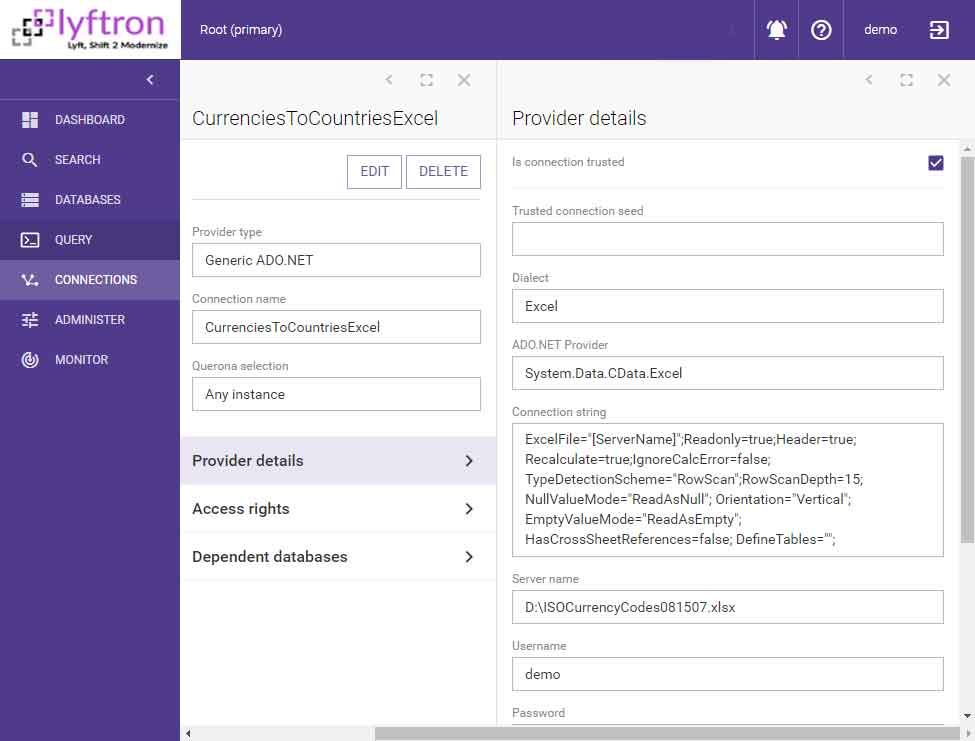
The second source is the Excel worksheet with countries mapped to currency codes. We select an Excel data provider and enter the path to Excel worksheet:

Every data source has its own virtual database registered in Lyftrondata. Here we have [Fixer.io DB]:

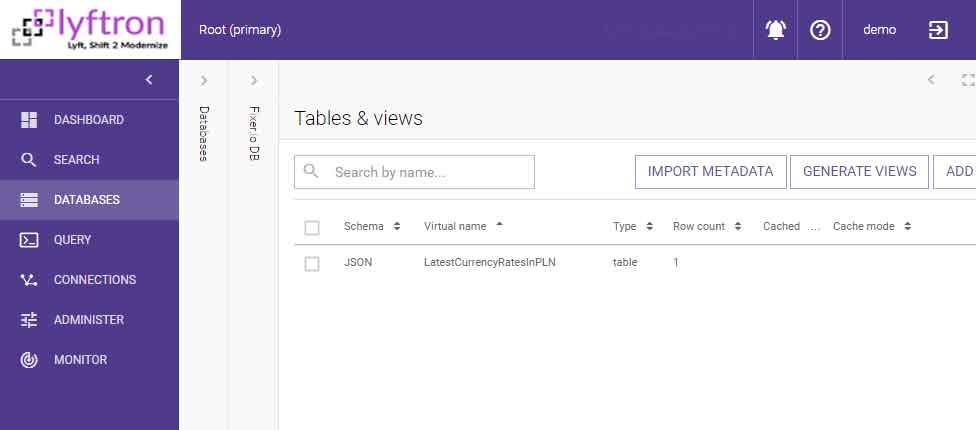
… and [CurrenciesToCountriesDB]:

Since [LatestCurrencyRatesInPLN] is JSON-based and its first representation is just a row, we need to wrap it into a view. So we do manual transpose from:
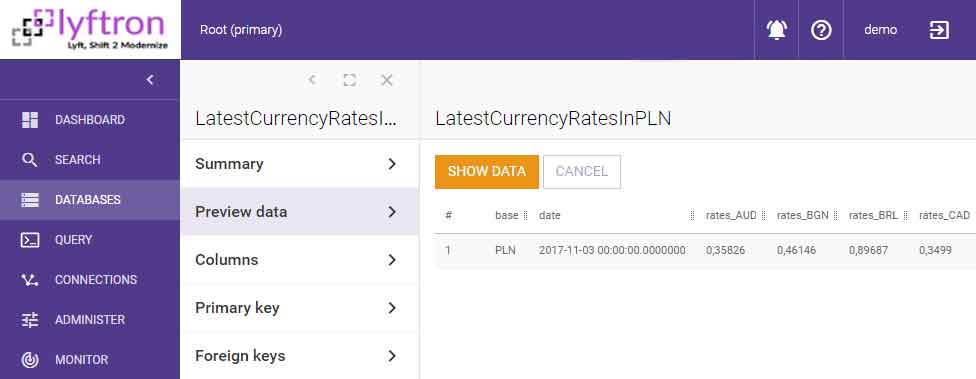
…into:

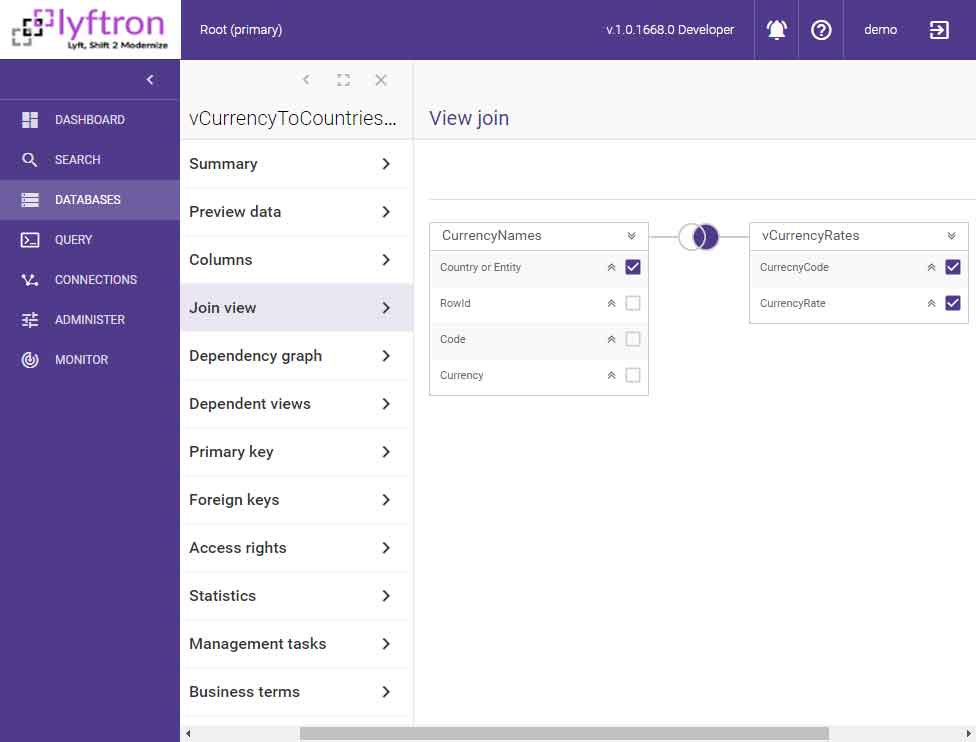
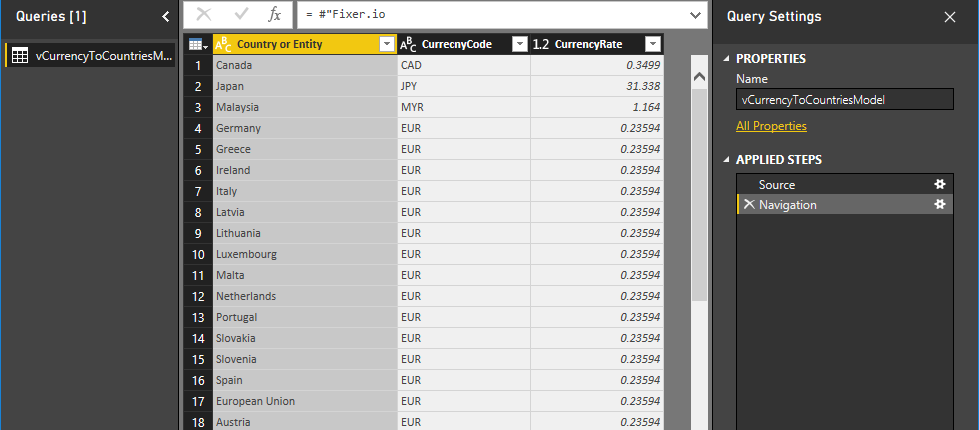
Now it’s time to prepare the final view which will serve as the one and only source for the PowerBI report. The view can be prepared as a joined view:

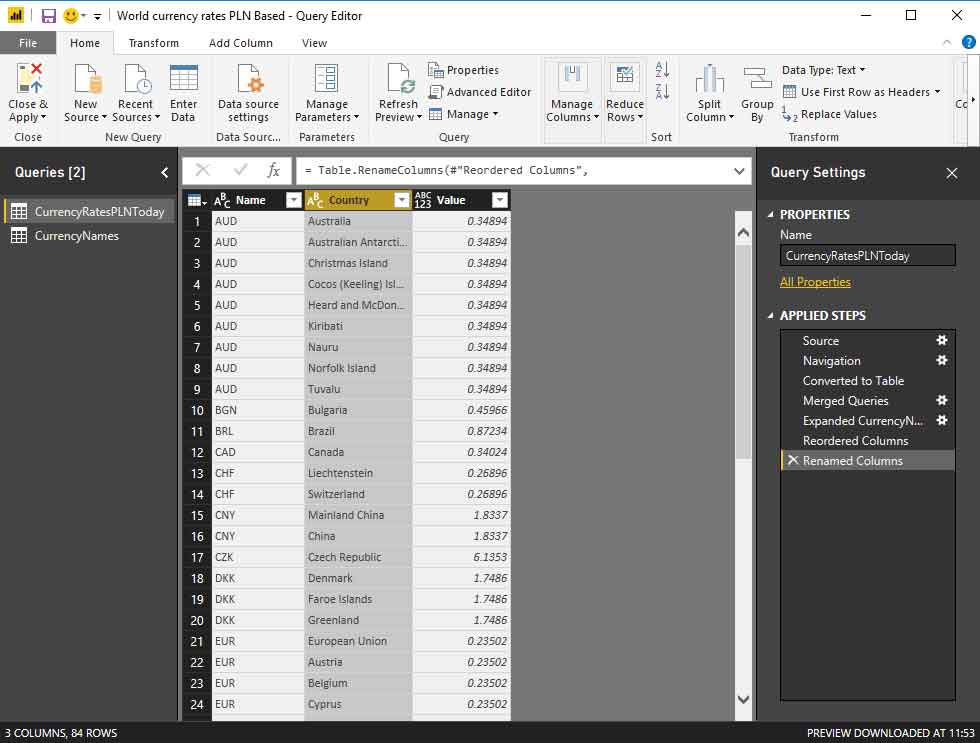
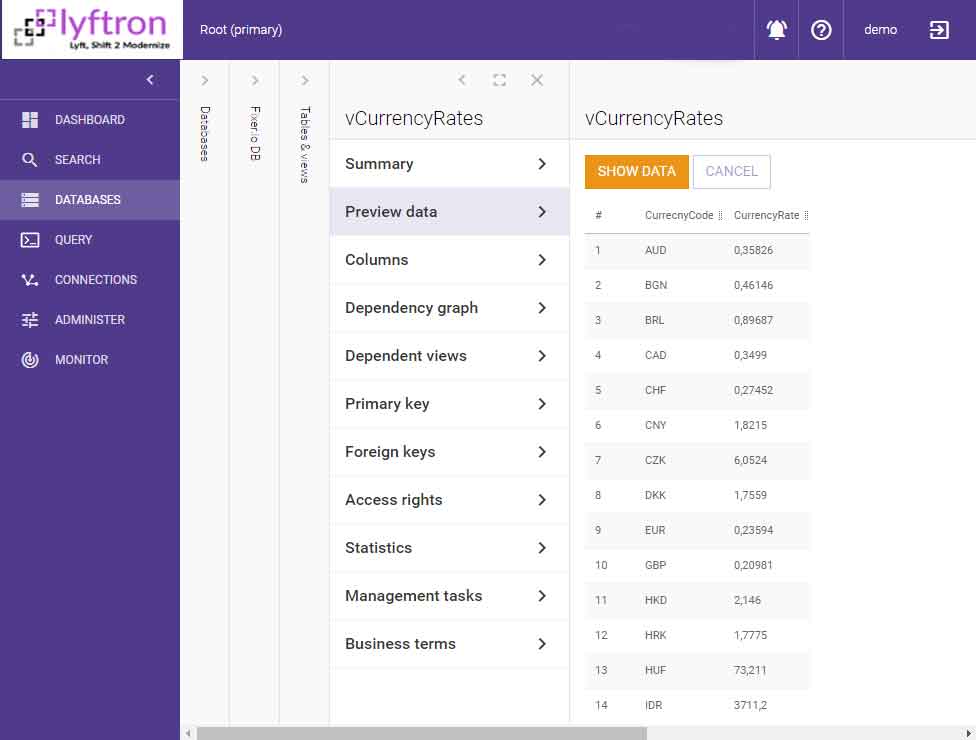
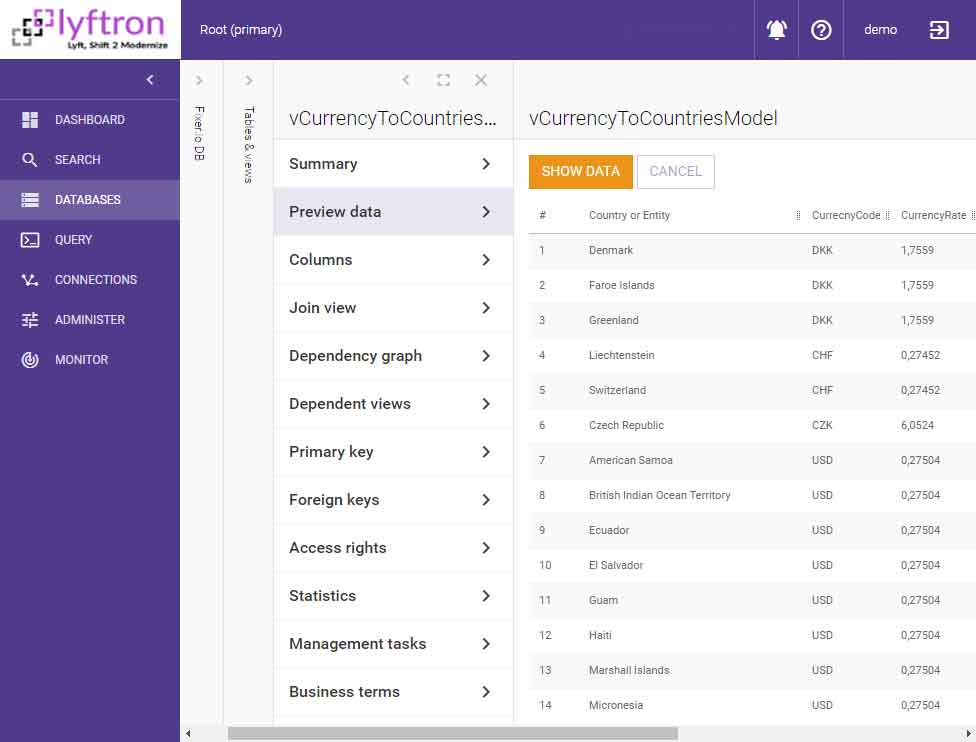
Finally, we have the latest form of data:

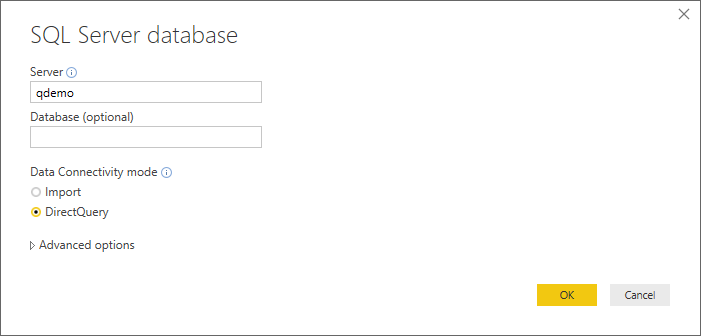
Let’s see how PowerBI can consume the new, integrated data source: 1. Connect to the Lyftrondata instance – please note that DirectQuery mode is enabled and used:

2. Prepare the query:

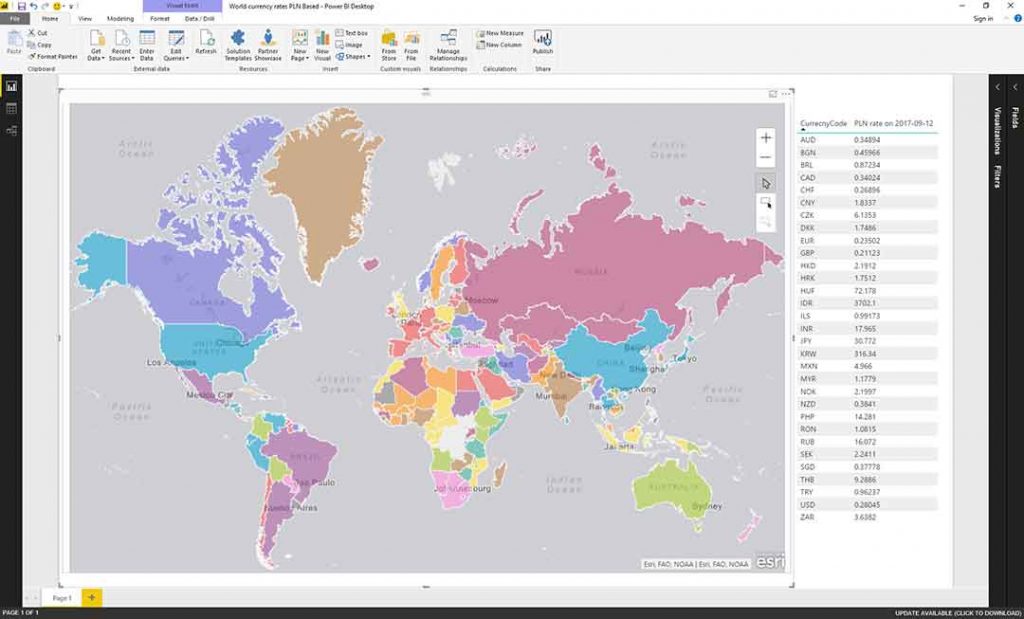
3. Design the report:

Final Words

By using Lyftrondata data virtualization capabilities, we gain quite a few advantages:
  • The data model can be shared and reused among many client tools, including analytical, reporting, AI, and others.
  • Tool-specific restrictions are overcome so a tool can access data in a direct query mode. The tool was tricked into interpreting that all data came from one place (thanks to MS SQL Server emulation in Lyftrondata).
  • The report is big-data ready – thanks to Lyftrondata, data does not have to be moved from its origin. If necessary, data can be cached on a big data platform, or in a cloud, in a completely transparent way, without any changes to our report.

Recent Posts