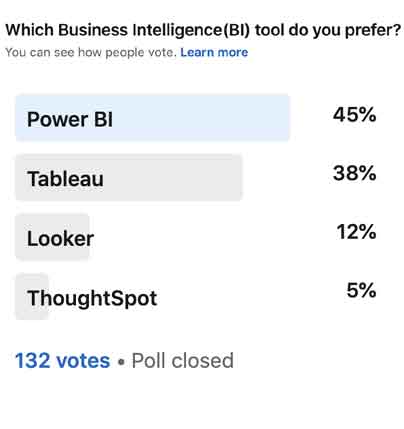
Lyftrondata recently conducted a poll in which enterprises were asked to choose between four BI Tools and to explain which one they would opt for to get the best actionable insights. Take a look at the results.


With several BI Tools available in the market, enterprises have many good options. With so many choices it can be a daunting task to decide which BI tool to choose to get the best value for their specific needs. To learn more about the decision-making process, Lyftrondata recently conducted a poll in which enterprises were asked to choose between four BI Tools and to explain which one they would opt for to get the best actionable insights.
Power BI ranked #1 with 45% of the votes. Tableau was #2 receiving 38% of the votes; Looker was #3 with 12% votes, and Thoughtspot was #4 with 5% of the votes. Let us now take a quick look at how Lyftrondata works with BI Tools to simplify data management and business analytics.
Power BI is a collection of software services, apps, and connectors that work together to turn your unrelated sources of data into coherent, visually immersive, and interactive insights. Your data may be an Excel spreadsheet or a collection of cloud-based and on-premises hybrid data warehouses. Power BI lets you easily connect to your data sources, visualize and discover what’s important, and share those visualizations with anyone you want.
- Businesses can input large quantities of data into Power BI that many other platforms would struggle to process.
- Built-in machine learning features can analyze data and help users spot valuable trends and make educated predictions.
- Information can be visualized using powerful templates to allow businesses to make better sense of their data.
- Power BI is cloud-based, so users get cutting edge intelligence capabilities and powerful algorithms that are updated regularly.
- Powerful personalization capabilities allow users to create dashboards so they can quickly access the data they need.
- Users can set up alerts on KPIs to keep users up-to-date on important metrics and measurements.
- Power BI has an intuitive interface that makes it far more user-friendly and easy to navigate than complex spreadsheets.
- The platform integrates with other popular business management tools like SharePoint, Office 365, and Dynamics 365, as well as other non-Microsoft products like Spark, Hadoop, Google Analytics, SAP, Salesforce, and MailChimp.
- Power BI ensures data is safe, offering granular controls on accessibility both internally and externally.


Key Highlights:
- Seamlessly connects more than 100 types of data sources.
- Consolidates data on the fly without an ETL that is time-consuming to build and operate.
- Combines the agility of instant, real-time analytics of self-service BI tools like Power BI with the data quality and acceleration features of a traditional data warehouse.
- Fosters collaboration in the area of data management for BI users by decreasing dependency on IT departments.
- Leverages the best Big-data SQL engines like Apache Spark to get the best performance.
- Provides a model for any presentation tool or data analysis such as Power BI, Excel, Tableau, or Qlik.
Lyftrondata acts as a query accelerator and gives a speed boost to the Power BI dashboard using in-memory analytics and the powerful Apache Spark Big Data engine. It transparently rewrites queries from Power BI to use a pre-aggregated copy. Lyftrondata uses Apache Spark for in-memory processing combined with materialized views that store pre-aggregated data. A SaaS version of Power BI has a limited set of supported connectors;, however, it can connect to a SQL Server. Lyftrondata emulates SQL Server and may be installed in the cloud or on-premise and will serve as a data layer for Power BI.
Any data source in Lyftrondata is transformed into an SQL query that can be directly attached with Direct Query in Power BI. Lyftrondata simulates Microsoft SQL Server and is recognized by Power BI as an SQL Server instance. Connection from Power BI to Lyftrondata is realized through the standard Microsoft SQL Server connector, Lyftrondata translates Transact SQL to over 100 data sources. As a result, there will be only one data source in all dashboards thereby simplifying development.
Explore how Lyftrondata in empowering Power BI users with actionable insights.
Tableau Software helps people see and understand data. Offering a revolutionary new approach to business intelligence, Tableau allows you to quickly connect, visualize, and share data with a seamless experience from the PC to the iPad. Create and publish dashboards and share them with colleagues, partners, or customers—no programming skills required. Tableau Software is one of the fastest-growing data visualization tools in the BI industry. It is a great choice for transforming a raw set of data into an easily understandable format while requiring zero technical skills and coding knowledge.
- Tableau has widespread usage because of the speed and ease by which data can be analyzed. Also, visualizations are generated as dashboards and worksheets.
- Tableau allows users to create dashboards that provide actionable insights to drive the business forward.
- Tableau products always operate in virtualized environments when they are configured with the proper underlying operating system and hardware.
- Tableau is used to explore data with limitless visual analytics.